%20or%20the%20dark%20window%20chrome.%20Any%20surface%20that%20needs%20it%20in%20another%20colour%20uses%20the%20file%20as%20a%20CSS%20mask%20and%20paints%20it%20with%20a%20token,%20rather%20than%20a%20second%20copy%20of%20the%20geometry%20in%20another%20colour.%20--%3e%3csvg%20viewBox='0%200%20512%20512'%20xmlns='http://www.w3.org/2000/svg'%20width='512'%20height='512'%3e%3cdefs%3e%3c!--%20The%20gaps%20in%20the%20rings:%20one%20column%20and%20one%20row,%20cut%20out%20of%20both.%20--%3e%3cmask%20id='mk-rings'%3e%3crect%20width='512'%20height='512'%20fill='%23fff'/%3e%3crect%20x='234'%20y='0'%20width='44'%20height='512'%20fill='%23000'/%3e%3crect%20x='0'%20y='234'%20width='512'%20height='44'%20fill='%23000'/%3e%3c/mask%3e%3c/defs%3e%3cg%20mask='url(%23mk-rings)'%20fill='none'%20stroke='%23ffffff'%20stroke-width='26'%3e%3crect%20x='96'%20y='96'%20width='320'%20height='320'%20rx='92'/%3e%3crect%20x='152'%20y='152'%20width='208'%20height='208'%20rx='62'/%3e%3c/g%3e%3ccircle%20cx='256'%20cy='256'%20r='70'%20fill='%23ffffff'/%3e%3c/svg%3e)
Database profiler
The log of slow operations, grouped by query shape. It is the fastest route from the server is busy to this query needs this index.
What it costs, before anything else
Profiling is not free, and level 2 is not free at all
- Profiling is per database, and it is a server-side setting you are changing. It stays on until somebody turns it off.
- Level 1 records operations slower than a threshold you set. On a busy database that can still be a lot of writes.
- Level 2 records every operation — including the reads this panel makes —
and
system.profileis a small capped collection, so it rolls over quickly and it costs a write per operation. - The failure mode is somebody enabling profiling on production and forgetting. TableCore is arranged around that: the level you found is remembered and offered back to you, and the offer only disappears once the server confirms it has been restored.
sampleRateexists exactly so you can profile a busy server without paying for everything. It is exposed here rather than buried.
The current level is named before anything is proposed, and a change goes through a confirmation naming the database, the level and the threshold. Level 2 carries its own sentence about the cost, shown while you are choosing, not after you have applied it.
Everything here is per database
The profiling level, the system.profile collection and its contents belong to
one database. "Profiling is off" is therefore never a statement about the
deployment, and the panel treats it that way — the state comes from the result of
its own call for the database you are looking at, not from something remembered
about the connection.
Changing the database in the selector also clears the restore offer: the offer belongs to the database the change happened on.
Three separate permissions
Reading the level, changing it, and reading system.profile are three different
capabilities, because deployments grant them differently — and a mongos
answers the read and refuses the change. A refused change stands beside the
level rather than replacing it.
Being refused the level read ends the questions: on a real deployment the level
and system.profile need the same role, so the second command would bring the
same refusal and no new information. On shared Atlas tiers neither is permitted
at all.
A router has nothing to show. A mongos holds no collections and so has no
system.profile of its own. That is a topological fact and is decided before
anything is sent.
The grouped view
The panel opens grouped, and that is the point of it. A list of individual entries answers which operation was slow; people arrive with which query is slow, and neither Compass nor the shell answers that. The operation list stays, one click away.
- Sorted by total time, not by the worst single execution. A query taking 40 ms run a hundred thousand times costs more than one four-second query, and sorting by the slowest execution hides exactly that case.
- The key is the server's query hash, and where the server does not provide
one, a shape read from the command: field paths and operator names with every
literal removed. An
$inwith a thousand values is one shape, not a thousand. The panel says which of the two keys it used, because the hash is the server's binding opinion and the description is TableCore's reading. - Median beside mean. A shape whose mean was dragged up by one bad execution has a median near the bottom; one that is slow every time does not.
- Several plan cache keys under one shape is the signature of a plan cache problem — the same query answered by different plans — and it is not visible anywhere else.
- The example is one execution and is labelled as one. The worst of them, with its real values, because its plan and its numbers are what you came for. Those values belong to that operation, not to the group.
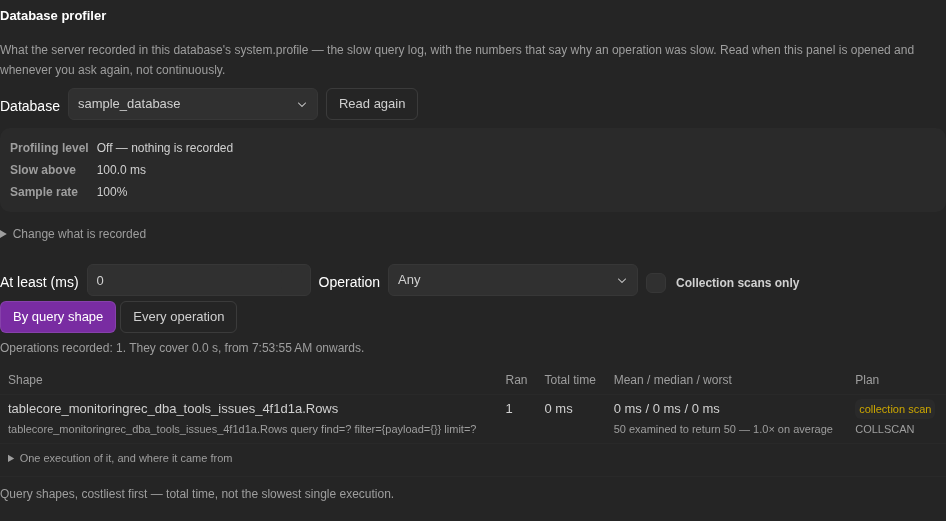
The three numbers that matter
| Reading | Why |
|---|---|
| Plan summary | A collection scan is visible without expanding the row |
| Documents examined vs returned | Read amplification. "400,000 to answer with twelve" says more than either number alone |
| Keys examined vs documents examined | Whether an index did the work, or the collection did |
Zero returned is a different sentence, not a division by zero. An operation that examined 400,000 documents and returned nothing is not infinitely amplified: the panel says examined N, returned nothing. Neither number present is a third case, and also not zero.
The window the numbers cover
system.profile is capped and rolls over, and the read stops at a limit. So the
panel says how many operations the totals cover and from when — and when the
limit was reached, it says plainly that the profiler may hold older operations
these totals do not include.
With sampleRate below 1, every number is a sample and every total derived
from it is an estimate. That is written beside the numbers, not in a tooltip.
The grouped view asks for more history (500 entries) than the list (50): counting executions over the last fifty operations would answer a different question from the one the view exists for.
From a profiled operation to a query tab
This is what makes the profiler part of TableCore rather than a dashboard.
A recorded read opens as a query: find, aggregate, count and distinct
are turned back into shell text the workspace parser reads, and the selection
moves to the database the operation ran in, because that is the only place the
query means anything. For find and aggregate there is also explain the
plan, which opens the explain dialog.
Shapes the workspace does not run — insert, getMore, administrative commands
— get no button. A button that opens a tab the workspace will refuse is worse
than no button.
Filtering
The filter runs on the server: minimum duration, namespace (quoted and anchored, as in current operations), operation kind, and collection scans only. The panel's own reads are excluded from the list — at level 2 the list would otherwise grow by the query that produces it.
The profile is read when the panel opens and on request, never in the
sampler loop. system.profile is a collection, not a counter, and the panel is
here to watch the server rather than give it work.
Not yet available
Diagnostic rules — turning these measurements into named findings — are tracked work and are not available. Today the profiler shows and groups; the interpretation is yours.
A working order
- Set level 1 with a threshold, or level 2 with a
sampleRate, for one database. - Let it run under real load for as long as you need.
- Read the grouped view, sorted by total time.
- Take the top shape's example into a query tab, and explain it.
- Add the index. See Indexes.
- Restore the profiling level from the offer the panel is still showing you.