%20or%20the%20dark%20window%20chrome.%20Any%20surface%20that%20needs%20it%20in%20another%20colour%20uses%20the%20file%20as%20a%20CSS%20mask%20and%20paints%20it%20with%20a%20token,%20rather%20than%20a%20second%20copy%20of%20the%20geometry%20in%20another%20colour.%20--%3e%3csvg%20viewBox='0%200%20512%20512'%20xmlns='http://www.w3.org/2000/svg'%20width='512'%20height='512'%3e%3cdefs%3e%3c!--%20The%20gaps%20in%20the%20rings:%20one%20column%20and%20one%20row,%20cut%20out%20of%20both.%20--%3e%3cmask%20id='mk-rings'%3e%3crect%20width='512'%20height='512'%20fill='%23fff'/%3e%3crect%20x='234'%20y='0'%20width='44'%20height='512'%20fill='%23000'/%3e%3crect%20x='0'%20y='234'%20width='512'%20height='44'%20fill='%23000'/%3e%3c/mask%3e%3c/defs%3e%3cg%20mask='url(%23mk-rings)'%20fill='none'%20stroke='%23ffffff'%20stroke-width='26'%3e%3crect%20x='96'%20y='96'%20width='320'%20height='320'%20rx='92'/%3e%3crect%20x='152'%20y='152'%20width='208'%20height='208'%20rx='62'/%3e%3c/g%3e%3ccircle%20cx='256'%20cy='256'%20r='70'%20fill='%23ffffff'/%3e%3c/svg%3e)
Explain plans
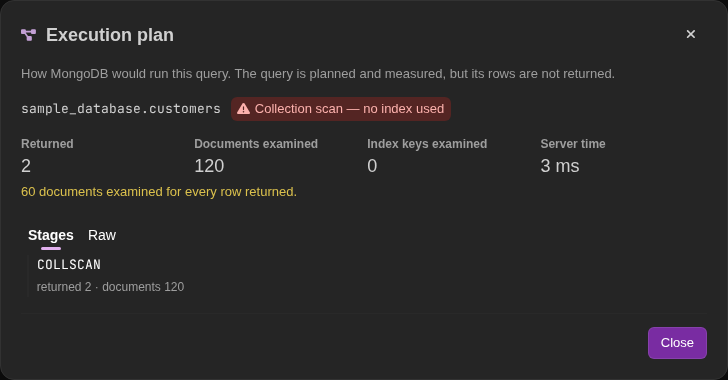
Explain asks the server how it would run the current query, and how much work that took. It is where you find out that the query is fine and the collection has no index.
What it does and does not touch
Explain plans and measures the query. It does not return rows, and it does not replace what is in your results grid — it is a separate answer about the same query. That is why it never asks for confirmation the way re-running a query does, and why pending grid edits are safe across it.
It explains the selection if you have one, and the whole statement otherwise — the same rule as running.
TableCore asks for executionStats, not queryPlanner. Without real counters
you cannot tell a cheap index hit from an expensive one.
What the summary shows
| Reading | Meaning |
|---|---|
| Returned | Rows the query produced |
| Documents examined | Documents the server had to look at |
| Index keys examined | Index entries the server had to look at |
| Server time | How long the server spent on it |
| n documents examined for every row returned | The ratio that tells you whether an index is doing its job |
The ratio is the number to read first. One document examined per row returned is an index doing exactly what it should. A thousand is a scan wearing a filter.
It is undefined when nothing was returned — dividing by zero would print infinity, which is not information.
Collection scans, including the ones that hide
Collection scan — no index used is carried explicitly rather than left for you to spot in a list of stage names, and it covers the whole run rather than just the first read. It detects:
- a
COLLSCANnested under another stage, - a
$lookupfor which the server counted collection scans, - a slot-based
EQ_LOOKUPwhose strategy is not an indexed loop join.
That last one matters most. A $lookup that reads the foreign collection once
per input document is the most expensive thing an aggregation can do, and it
never appears as a COLLSCAN in the outer plan. Without this check the plan
looks clean.
What to do about a collection scan
Create an index on the field being filtered, sorted or joined on, and explain again. Indexes covers creating them and reading their usage statistics — that page is what this one is for.
Reading the two shapes
A find plan is a tree, and a pipeline is a sequence, because they are
read differently.
- Pipeline: a list of boxes in execution order — position, stage name and
that stage's own counters. Expanding one shows the rest of its counters, and
the read plan nested under the
$cursorstage where the server puts it. The stage that reads the whole collection is expanded by default: it is the one finding you should not have to hunt for. find: the plan tree, as the server nests it.
Returned for a pipeline comes from the last stage; the $cursor counter
only says how many documents the read handed onward. Examined counts are summed
across pipeline stages, since those are separate reads — but never across nodes
of a single find plan, where they measure one read at several levels and
adding them would count it twice.
The Raw tab always holds the server's whole response, whatever the summary managed to make of it. A plan that cannot be summarised is still worth showing.
Which queries can be explained
Anything the engine runs as one command, including the aggregation shapes —
JOIN, GROUP BY, HAVING, DISTINCT, computed columns. Those are not
rebuilt for the explain: the engine is asked for the command it would actually
send, and that command is explained.
A query that runs as several commands is named rather than planned:
This query shape cannot be explained. The engine could not establish a single command for this run, so any plan shown here would describe a different query.
For the shapes with a known name — a set operation, a subquery read while the plan is being built — the dialog leads with the disclosure instead: the reason, then the numbered steps in execution order, each marked as happening on the server or in TableCore. Describing one of several commands as the whole answer is the lie by omission this feature exists to prevent.
A global aggregate is a special case and not a refusal: the command is real, it is just not the last thing that happens. You get the plan and the steps.
Why you can trust that the plan is the query
Until the engine could capture commands, explain guaranteed correctness by refusing everything it could not rebuild — it could not describe the wrong command because it described none.
Now that it explains a captured command, the guarantee is a test instead: an
opt-in suite against a real MongoDB runs each shape and explains it, and reads
the command to compare from the server's own echo — explain repeats the
command it received. So the other side of the comparison is what the server got,
not what the engine believes it sent.
Server versions
The reader is defensive on purpose: the response shape differs between server
versions and between find and aggregate. Newer servers wrap the tree in
winningPlan.queryPlan; an aggregation reports its planner under
stages[0].$cursor. A missing field yields nothing rather than an exception.
One version difference is worth knowing about. When the server used its
slot-based execution engine, executionStages is a physical plan whose stage
names (scan, hash_lookup, nlj) share no vocabulary with the logical plan
and contain neither COLLSCAN nor EQ_LOOKUP. TableCore takes the shape
from the logical tree in that case and the numbers from the totals beside it.
Measured on MongoDB 8.0.6, an ordinary SELECT … GROUP BY goes down that path
by default, and a full collection scan was being reported as clean — the worst
way this feature can be wrong.