%20or%20the%20dark%20window%20chrome.%20Any%20surface%20that%20needs%20it%20in%20another%20colour%20uses%20the%20file%20as%20a%20CSS%20mask%20and%20paints%20it%20with%20a%20token,%20rather%20than%20a%20second%20copy%20of%20the%20geometry%20in%20another%20colour.%20--%3e%3csvg%20viewBox='0%200%20512%20512'%20xmlns='http://www.w3.org/2000/svg'%20width='512'%20height='512'%3e%3cdefs%3e%3c!--%20The%20gaps%20in%20the%20rings:%20one%20column%20and%20one%20row,%20cut%20out%20of%20both.%20--%3e%3cmask%20id='mk-rings'%3e%3crect%20width='512'%20height='512'%20fill='%23fff'/%3e%3crect%20x='234'%20y='0'%20width='44'%20height='512'%20fill='%23000'/%3e%3crect%20x='0'%20y='234'%20width='512'%20height='44'%20fill='%23000'/%3e%3c/mask%3e%3c/defs%3e%3cg%20mask='url(%23mk-rings)'%20fill='none'%20stroke='%23ffffff'%20stroke-width='26'%3e%3crect%20x='96'%20y='96'%20width='320'%20height='320'%20rx='92'/%3e%3crect%20x='152'%20y='152'%20width='208'%20height='208'%20rx='62'/%3e%3c/g%3e%3ccircle%20cx='256'%20cy='256'%20r='70'%20fill='%23ffffff'/%3e%3c/svg%3e)
Server metrics
TableCore has a live server monitor: throughput, latency, connections, network, memory, cache, concurrency tickets, and the busiest collections. Open it from a connection's context menu.
It is not gated. Every plan has it.
What it costs your server
A monitoring tool that is itself load has to say so.
- It only polls while somebody is looking. The loop starts with the first open panel and stops with the last. A panel you navigated away from does not keep questioning production, and when the last watcher goes, the samples go with it — they carry server load figures and client host names, and none of it is ever written to disk.
- The loop waits first, then polls. A panel that wants a reading immediately asks for one. So the answer to when does this talk to my server? is: on the interval, and when somebody explicitly asks.
- The sampler's
serverStatuscommand excludes subsections ofmetricsrather than the whole section, which makes the response about half the size of a full one. - The heavier reads are deliberately rarer: the busiest-collections view every fifth poll, current operations every second poll, replica set and oplog every fifth. The profiler is not in the loop at all.
History starts when you open the panel
This is not a metrics database
The panel says so at every time window, and it matters: a 20-minute window over 90 seconds of samples must not look like 20 minutes of a quiet server. The longest window offered is exactly what the sampler's buffer holds — offering an hour would promise history nobody recorded.
If you need history across restarts, across machines, or from before you started looking, you need a monitoring system. This panel answers what is the server doing now, and what has it been doing since I opened this.
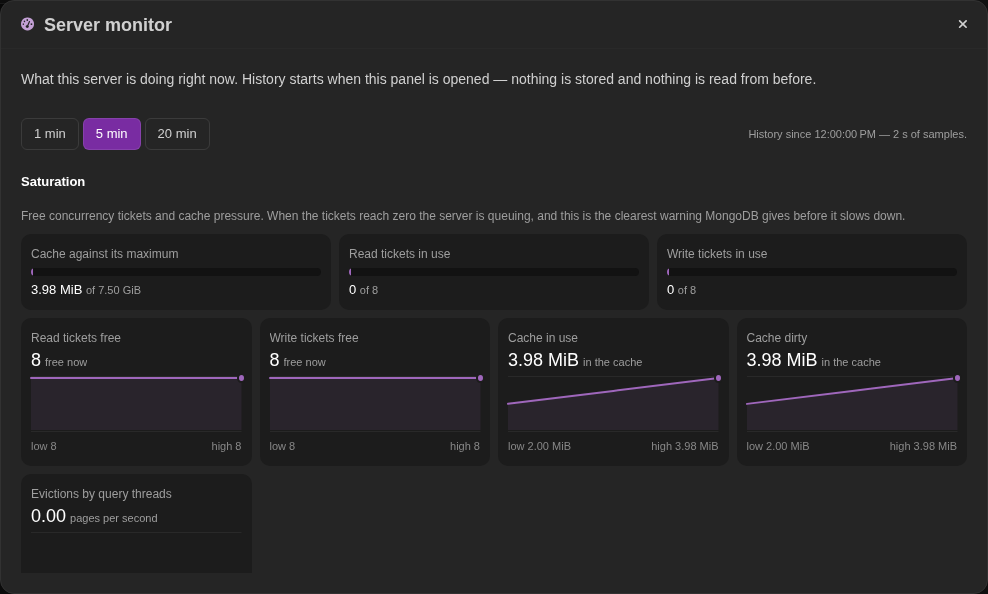
Saturation sits above throughput
That ordering is deliberate, and it is the part most clients do not show.
- Free read and write tickets against the pool size. The free ticket count on its own is not a signal: "8 free" is nearly the whole 128-ticket pool on MongoDB 6.0 and the entire 8-ticket pool on 8.0. So the gauge always carries the limit.
- Cache used against the configured maximum, for the same reason.
- Where there is no limit to report — a
mongosrouter — the gauge says not reported rather than drawing an empty track.
The six operation counters are a table, not six charts: the same information in a tenth of the space, with each row keeping its unit.
Rates need two readings
A level needs one reading; a rate needs two. So tickets, connections and cache appear one reading before any rate does, and a chart with no pair of readings says a rate needs two readings rather than implying the server is idle.
Rates are computed from differences between counters, not by keeping raw counters and subtracting later. A server restart sets every counter back to zero, which makes the difference a large negative number — drawing that as a spike, as zero, or as a negative rate would all be inventions, so the window is marked as counters reset. What decides is uptime going backwards; a single missing counter is not a restart, because treating it as one would throw away a whole window of good numbers.
Latency is reported as the average over the window, not since server start. A cumulative average after a day of uptime flattens out and stops saying anything.
An unavailable metric is a stated condition
Never a zero, never an empty chart. A refused command does not add a sample. A flat line drawn for I was not allowed to look reads as a fact about the server.
Capabilities are resolved per command, not per connection, because that is
how real deployments restrict them: Atlas shared tiers answer serverStatus and
refuse $currentOp; an account can have readWrite without clusterMonitor;
and the busiest-collections command is a mongod command a mongos has never
heard of.
A refusal has three meanings and three different sentences:
| Reason | What to do |
|---|---|
| No privilege | Fixable with a role — usually clusterMonitor |
| Not on this deployment | A limitation of the deployment. A role will not help |
| Unreachable | May work on the next sample |
Getting that distinction right matters: hosting tiers refuse with an ordinary
authorization code and explain themselves in words, so TableCore reads the words
before the code. Sending such a user off to request clusterMonitor sends
them somewhere nobody can help them.
Topology rules some capabilities out before anything is sent — it costs no round trip and gives a better sentence than a server refusal. An unknown topology rules out nothing; the server can answer for itself.
Reading the server defensively
Fields move between server releases —
wiredTiger.concurrentTransactions became queues.execution in 7.0 — and the
same counter arrives as an int, a long or a double depending on the server
and on how large it has grown. A missing field yields nothing rather than an
exception, and never a quietly wrong number.
What to look at when something is wrong
- Saturation first. Tickets near zero means the server is at its concurrency limit; everything else you are about to look at is a symptom of that.
- Read amplification. If throughput is modest and the server is busy, the queries are examining far more than they return — go to the profiler and then to indexes.
- Current operations. Something long-running and specific: current operations.
- Replication. On a replica set, a growing lag or a shrinking oplog window changes what the other numbers mean: replica sets and the oplog.